
ErgoBow
Threats on the left, the top event in the centre, consequences on the right, and barriers that carry a real human error probability. Now with the fault tree behind the threat and the event tree after the top event.
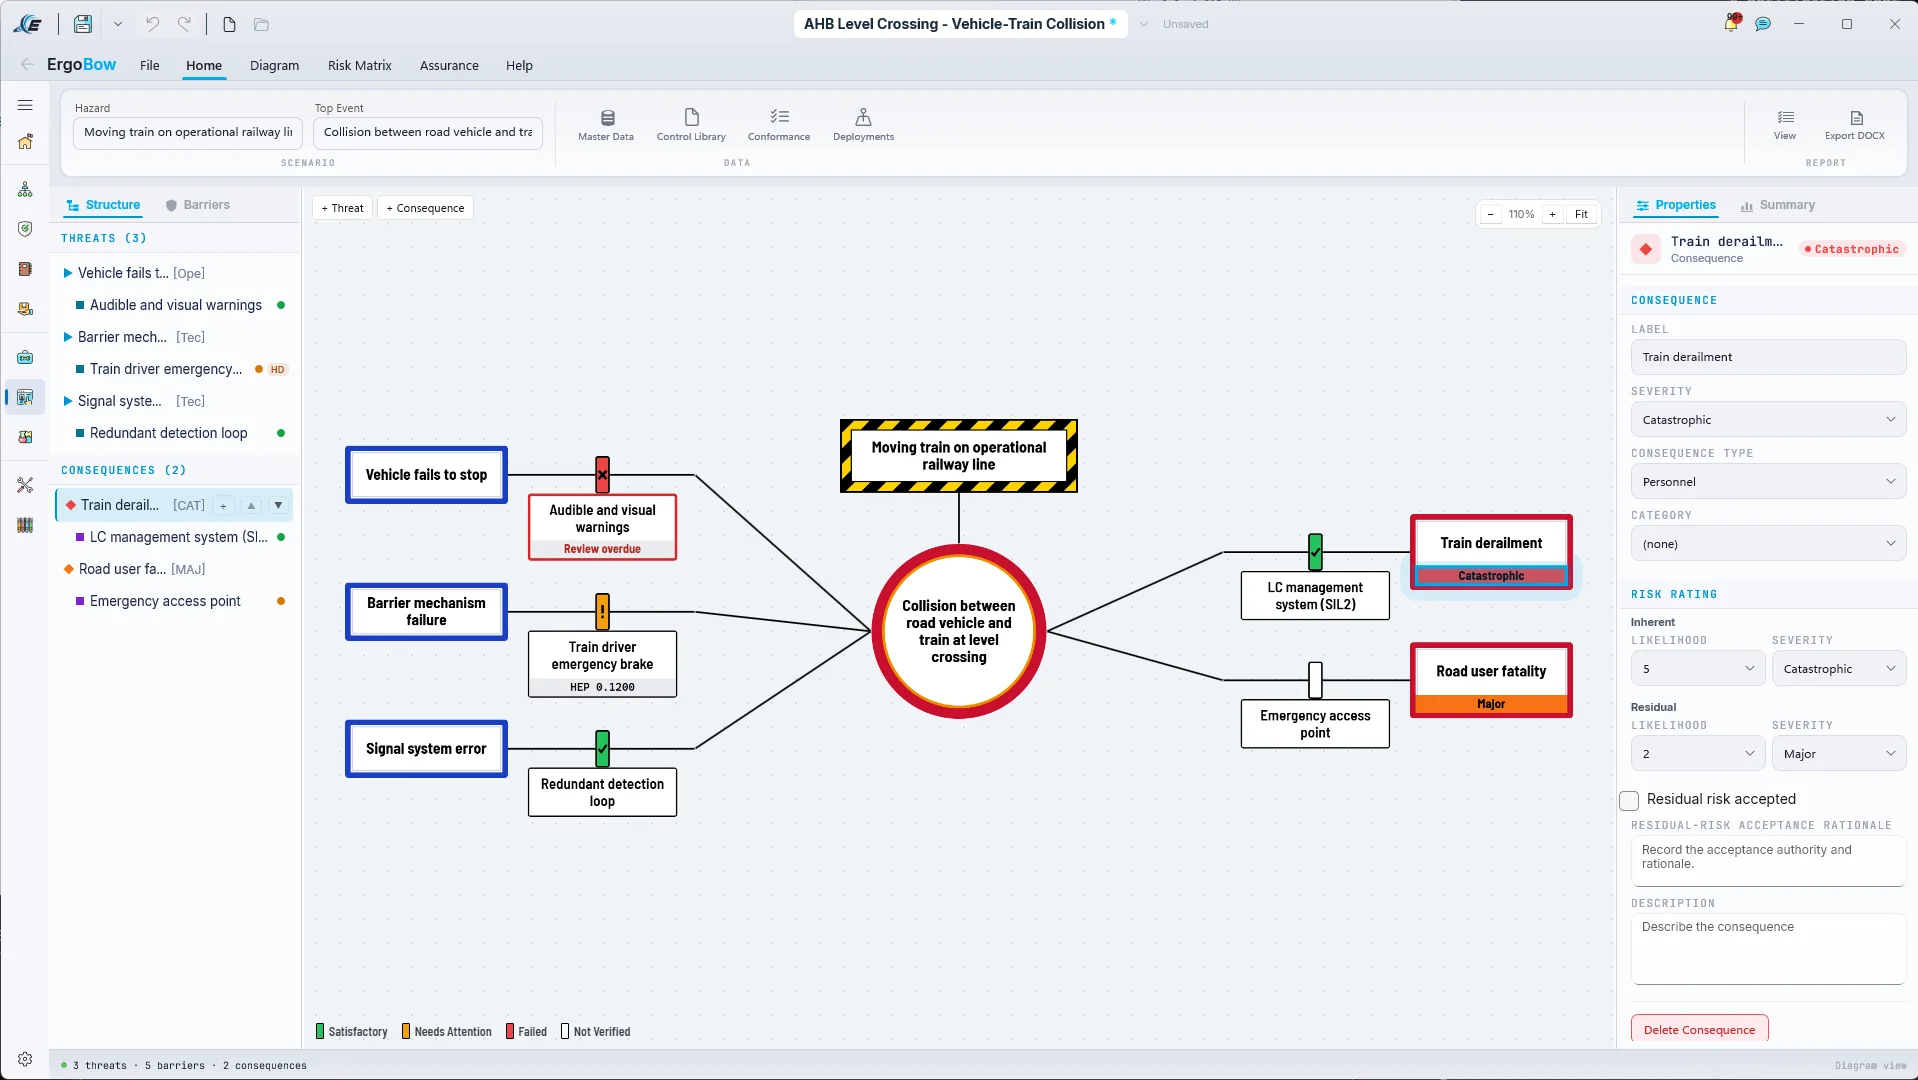
- AHB Level Crossing · Vehicle-Train Collision
- 3 threats
- 5 barriers
- 2 consequences
- one human-dependent barrier, HEP 0.1200
-
The grammar, enforced
Hazard above the top event, threats to the left, consequences to the right. Preventive barriers anchor to threats and mitigative barriers to consequences, as you draw. The diagram cannot be drawn wrong.
-
A barrier with a human in it carries a number
Train driver emergency brake, HEP 0.1200. The HD badge in the structure panel marks every human-dependent barrier, and the probability is linked from a HEART+ assessment rather than typed in.
-
Status you can read across the room
Satisfactory, Needs Attention, Failed, Not Verified, on the barrier itself. A barrier whose review is overdue says so on the diagram, not in a report nobody opens.
-
Engineered barriers by their integrity
LC management system (SIL2). Every control is typed, behavioural or engineered, with its effectiveness, criticality and accountable owner, and threats are typed too: operational or technical.
-
Inherent and residual, side by side
Likelihood 5 and Catastrophic before the barriers; 2 and Major after them. The Risk Matrix tab reads the same two numbers, so the diagram and the matrix cannot disagree.
-
Acceptance is a record
Residual risk accepted is a tick box that asks for the acceptance authority and the rationale. An accepted risk with no reasoning behind it is not an accepted risk.
One Hazard, Three Trees.
A bowtie is two trees joined at the top event. The left half asks how the threat comes to be; the right half asks what follows once it has. Fault Tree Analysis and Event Tree Analysis are those two halves as methods in their own right, and in 1.7 they ship beside ErgoBow in the same project file, in Preview. A fault tree develops the top event down to its basic events and solves its probability exactly. An event tree starts from an initiating event, entered or linked to a fault tree as logic, and follows the barriers heading by heading to the end states the consequences name.
The bowtie's top event links to the fault tree's top and the event tree's initiating event, the relationship the CCPS and Energy Institute guidance Bow Ties in Risk Management (2018) describes. The links are for navigation and record: they carry no probability or frequency in either direction, and they do not establish how effective a barrier is. The screen says so.
A human reliability pack sold beside a bowtie tool with no fault tree and no event tree had a hole in it. These fill it.
Start the Bowtie From the Trees.
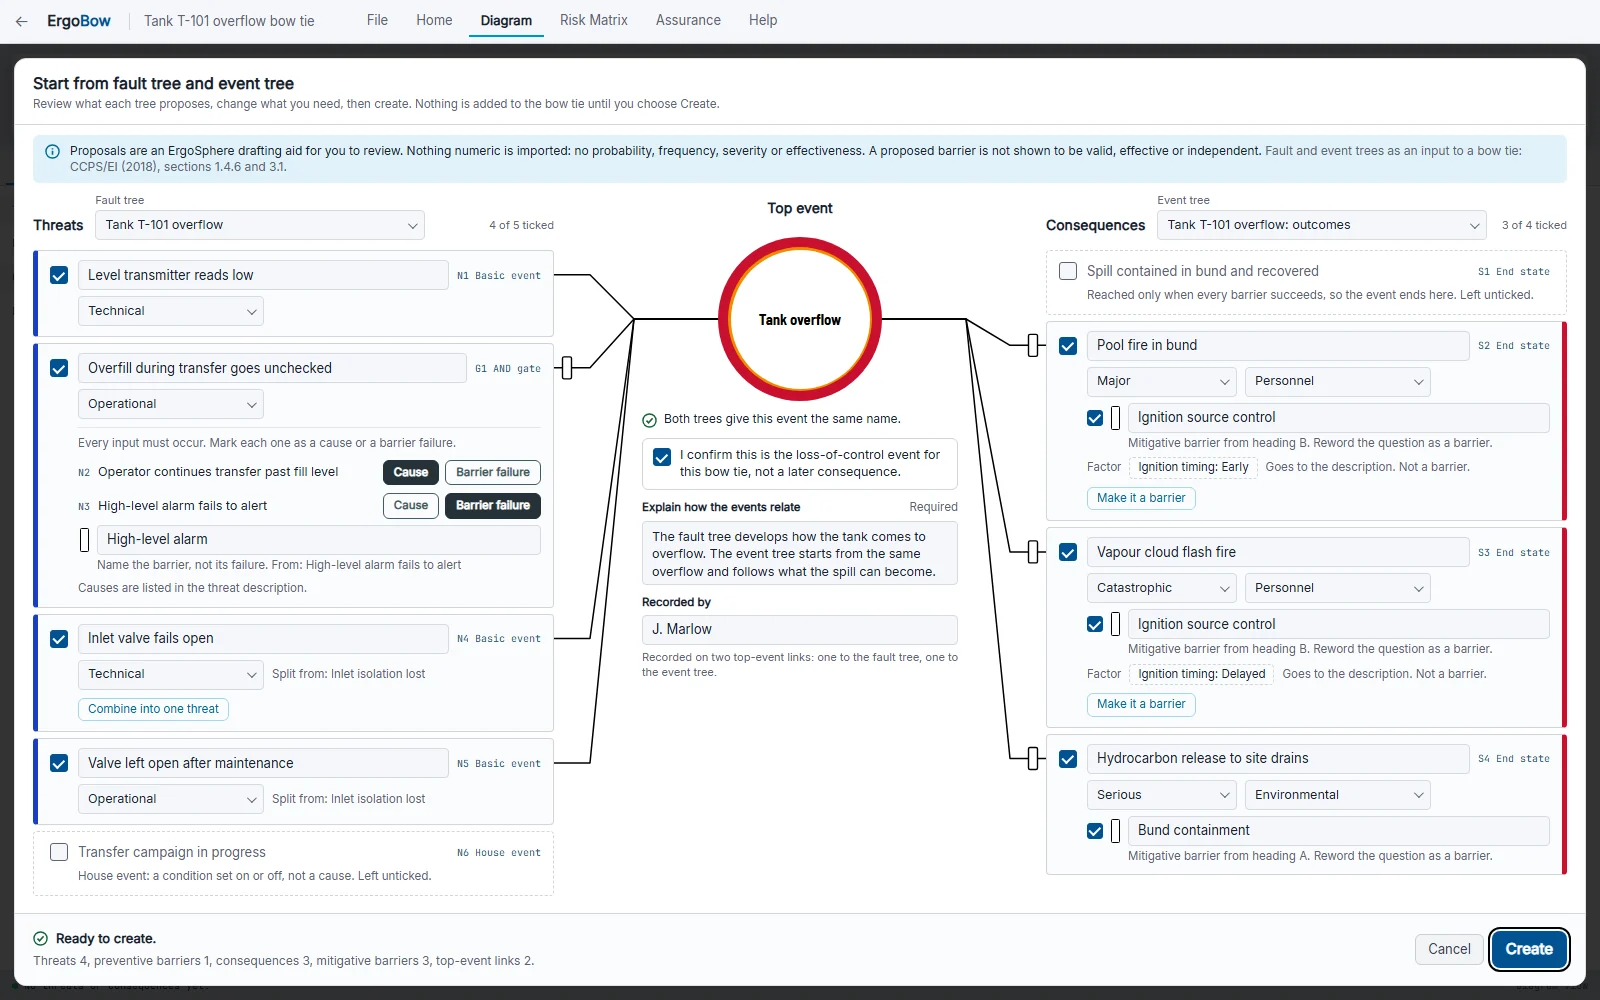
Where the fault tree and the event tree exist first, From Trees drafts the bowtie from them. The fault tree's first-level inputs are proposed as threats, with nested OR gates split on request, and each AND input is marked by the analyst as a cause or a barrier failure; a barrier failure becomes a preventive barrier. The event tree's end states are proposed as consequences, and its yes or no headings as mitigative barriers.
Nothing is chosen for you. Threat type, severity and consequence type wait for the analyst, a label that matches something already on the bowtie is flagged and left unticked, and the top event has to be confirmed as the loss of control, with the relationship explained in words. Create is one undo step. It records both top event links, keeps where the bowtie came from, and adds a Started from analyses passage to the report. No number crosses over.
- Proposed
- Threats
- Preventive barriers
- Consequences
- Mitigative barriers
- factors go to the description
- After
- Referenced by bow ties
- Related analyses in MAH
- Report reference rows
Quantified, Not Just Drawn.
A barrier in ErgoBow is a typed, rated thing. Behavioural or engineered, with its effectiveness, criticality and accountable owner, and flagged where it depends on a human. A human-dependent barrier carries a real Human Error Probability, linked from a HEART+ assessment in the same file rather than guessed into a cell. Launch a Safety Critical Task Analysis straight from the barrier task to characterise how the human fails.
Escalation factors that degrade a barrier are modelled explicitly, as nodes with their own controls, not left in the narrative. Every barrier wears its status on the diagram, and a review that falls overdue shows on the barrier that needs it.
The Risk Matrix tab reads the inherent and residual ratings the consequences already carry. Residual risk acceptance is a tick box with a required rationale, so the acceptance authority is on the record with the number.
- Status
- Satisfactory
- Needs Attention
- Failed
- Not Verified
- Status not tracked
- Review overdue
- Typed
- Ope
- Tec
- HD
- SIL
- HEP
- From the barrier
- HEART+
- SCTA
- Issues Register
img/screenshots/web/ergobow-barriers.webpimg/screenshots/web/ergobow-risk-matrix.webpA Bowtie Describes Controls. This One Governs Them.
ErgoBow carries an enterprise control library: canonical control records with a stable code, purpose, type and taxonomy, an accountable owner role, a lifecycle, effective dates, revision history and change rationale, and the applicability constraints and prohibited uses that say where a control must not be relied upon. Each carries a structured performance standard rather than a paragraph of prose: control objective, required functionality, availability, reliability, survivability, operating limits, response time, independence.
A barrier on the diagram is instantiated from the library as a version-pinned reference, so the bowtie states which revision of the control it relies on. When the library moves you get an explicit review, adopt or retain-current decision, never a silent update underneath a published diagram. Near-duplicate local controls are surfaced, because the failure mode of every control library is the same one: three slightly different versions of the same control, each maintained by someone who does not know about the other two.
Five barriers are five only if they fail independently
Controls declare what they depend on as typed, directional dependencies: power, telecommunications, detection platforms, shared assets, a person, role or contractor, a procedure or competency, an inspection capability, an external organisation, or another control. From that, the common-mode analysis finds barriers leaning on the same thing and ends the false defence-in-depth claim.
Reported, calculated and accepted health are three things
Multi-level assurance planning with an evidence registry behind it, and an accountable route from a failed control through temporary controls to restoration. The three healths are never collapsed into one number, and an aggregate with no populated inputs refuses to produce a result rather than scoring one.
Published revisions are immutable
Bowties and control records move from Draft through Technical Review, Control-Owner Acceptance, Independent Review and Approved to Published, then Periodic Review and Superseded. Work continues on a working copy, revisions compare semantically, and an emergency change mandates a retrospective review rather than skipping one.
img/screenshots/web/ergobow-control-library.webpimg/screenshots/web/ergobow-assurance.webpWhere the boundary is. ErgoBow is local-first and holds its records inside the project file. Where the model refers to an asset, maintenance, incident, document or competency system, it refers to them as identifiers you enter or import, not as a live connection. The domain model was built so that neither an integration API nor an enterprise deployment is a rewrite when it comes.
How the Threat Comes to Be.
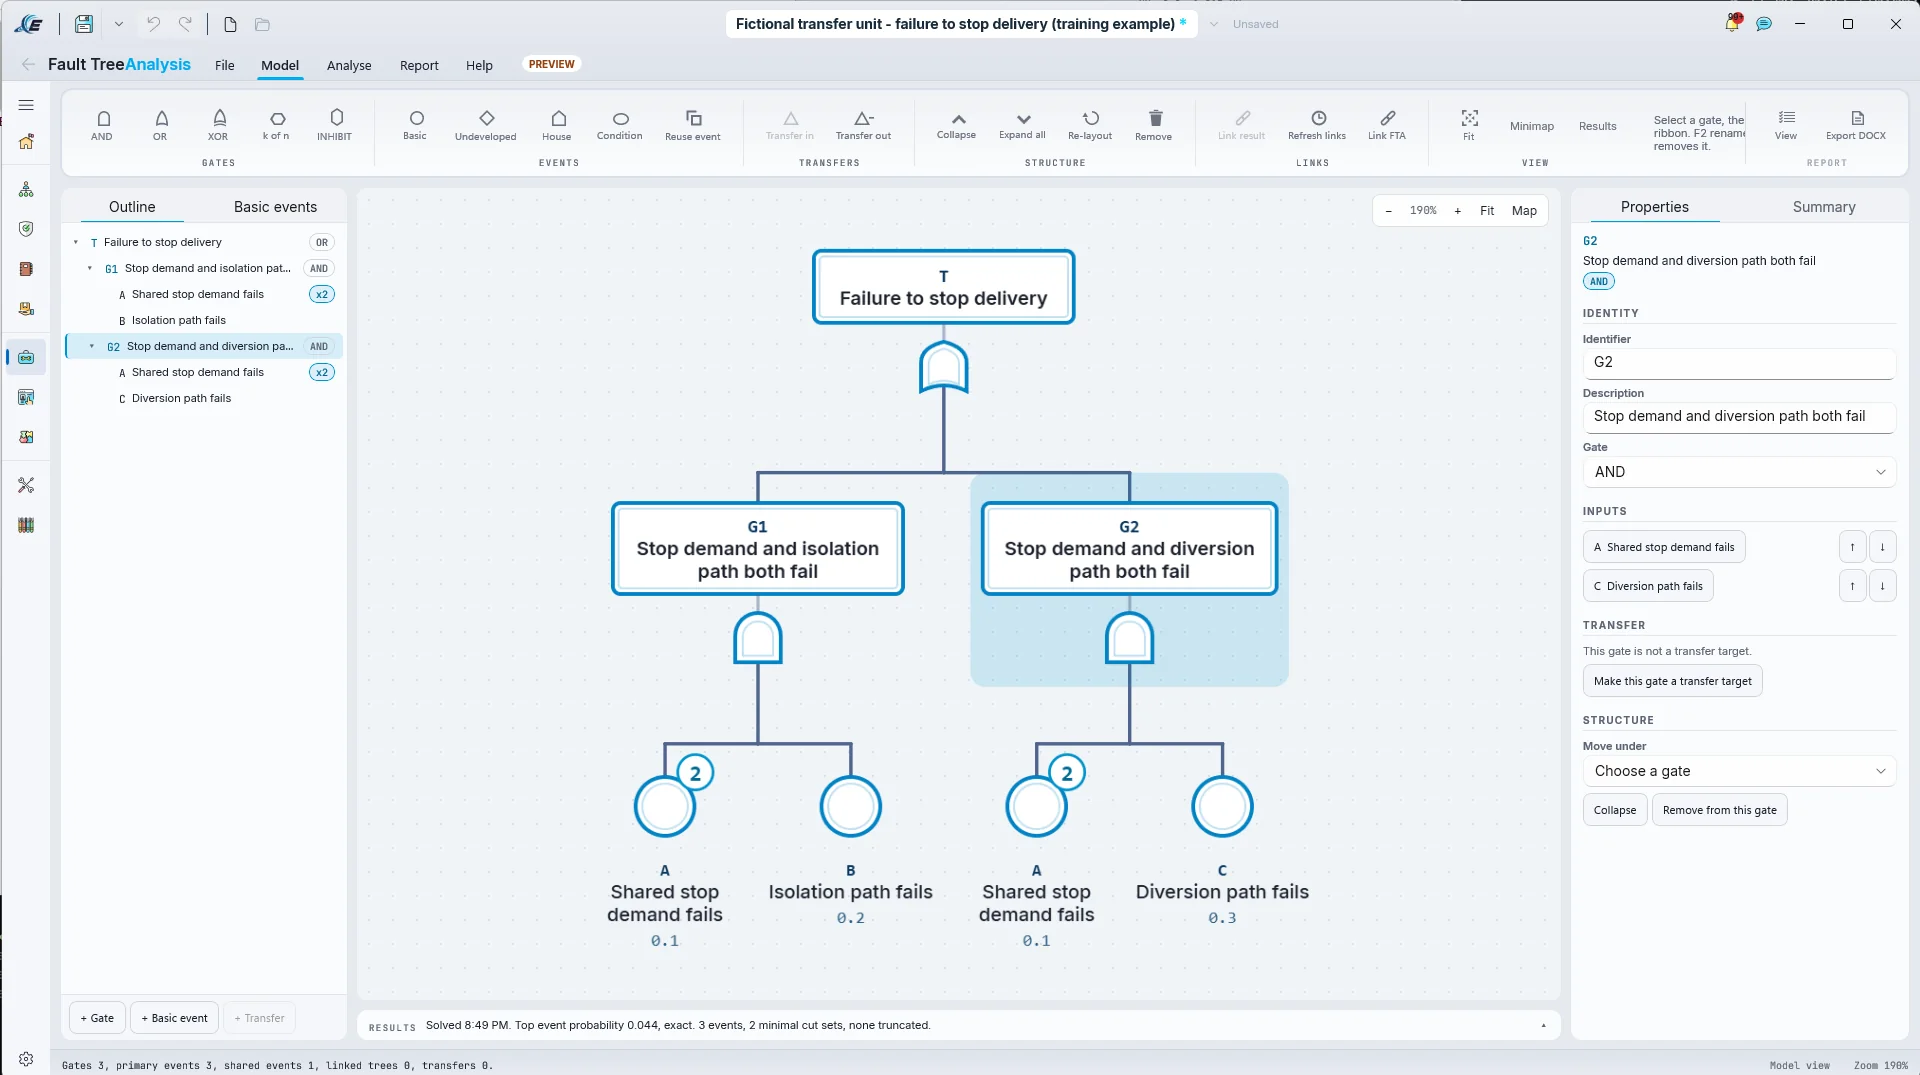
The fault tree starts from the undesired event and asks what has to fail for it to happen, gate by gate, down to the basic events. The ribbon carries the five gates and the five event types; the outline on the left mirrors the tree; and the Properties panel edits the selected gate's identifier, description, logic, inputs and transfer in one place. Select a gate and F2 renames it.
A basic event used in two places is one event, marked with its count, so a shared failure is counted once and the dependency is visible on the drawing. Make any gate a transfer target and reuse it across trees. A basic event can take its probability from a published THERP, SPAR-H, HEART or SLIM result in the same project, and a link that goes stale holds back the results that depend on it until you accept the current value.
Solve, and the result reads along the bottom: top event probability 0.044, exact. 3 events, 2 minimal cut sets, none truncated. Exact means exact, solved by binary decision diagram. The rare event sum and the cut set upper bound sit beside it as labelled companions, never as the headline, and a truncated cut set list says how much it left out.
- Gates
- AND
- OR
- XOR
- k of n
- INHIBIT
- Events
- Basic
- Undeveloped
- House
- Condition
- Reuse event
- Also
- Transfer in
- Transfer out
- Collapse
- Expand all
- Re-layout
- Minimap
- Link FTA
- Link result
- Export DOCX
img/screenshots/web/fta-results.webpWhat Follows The Top Event.
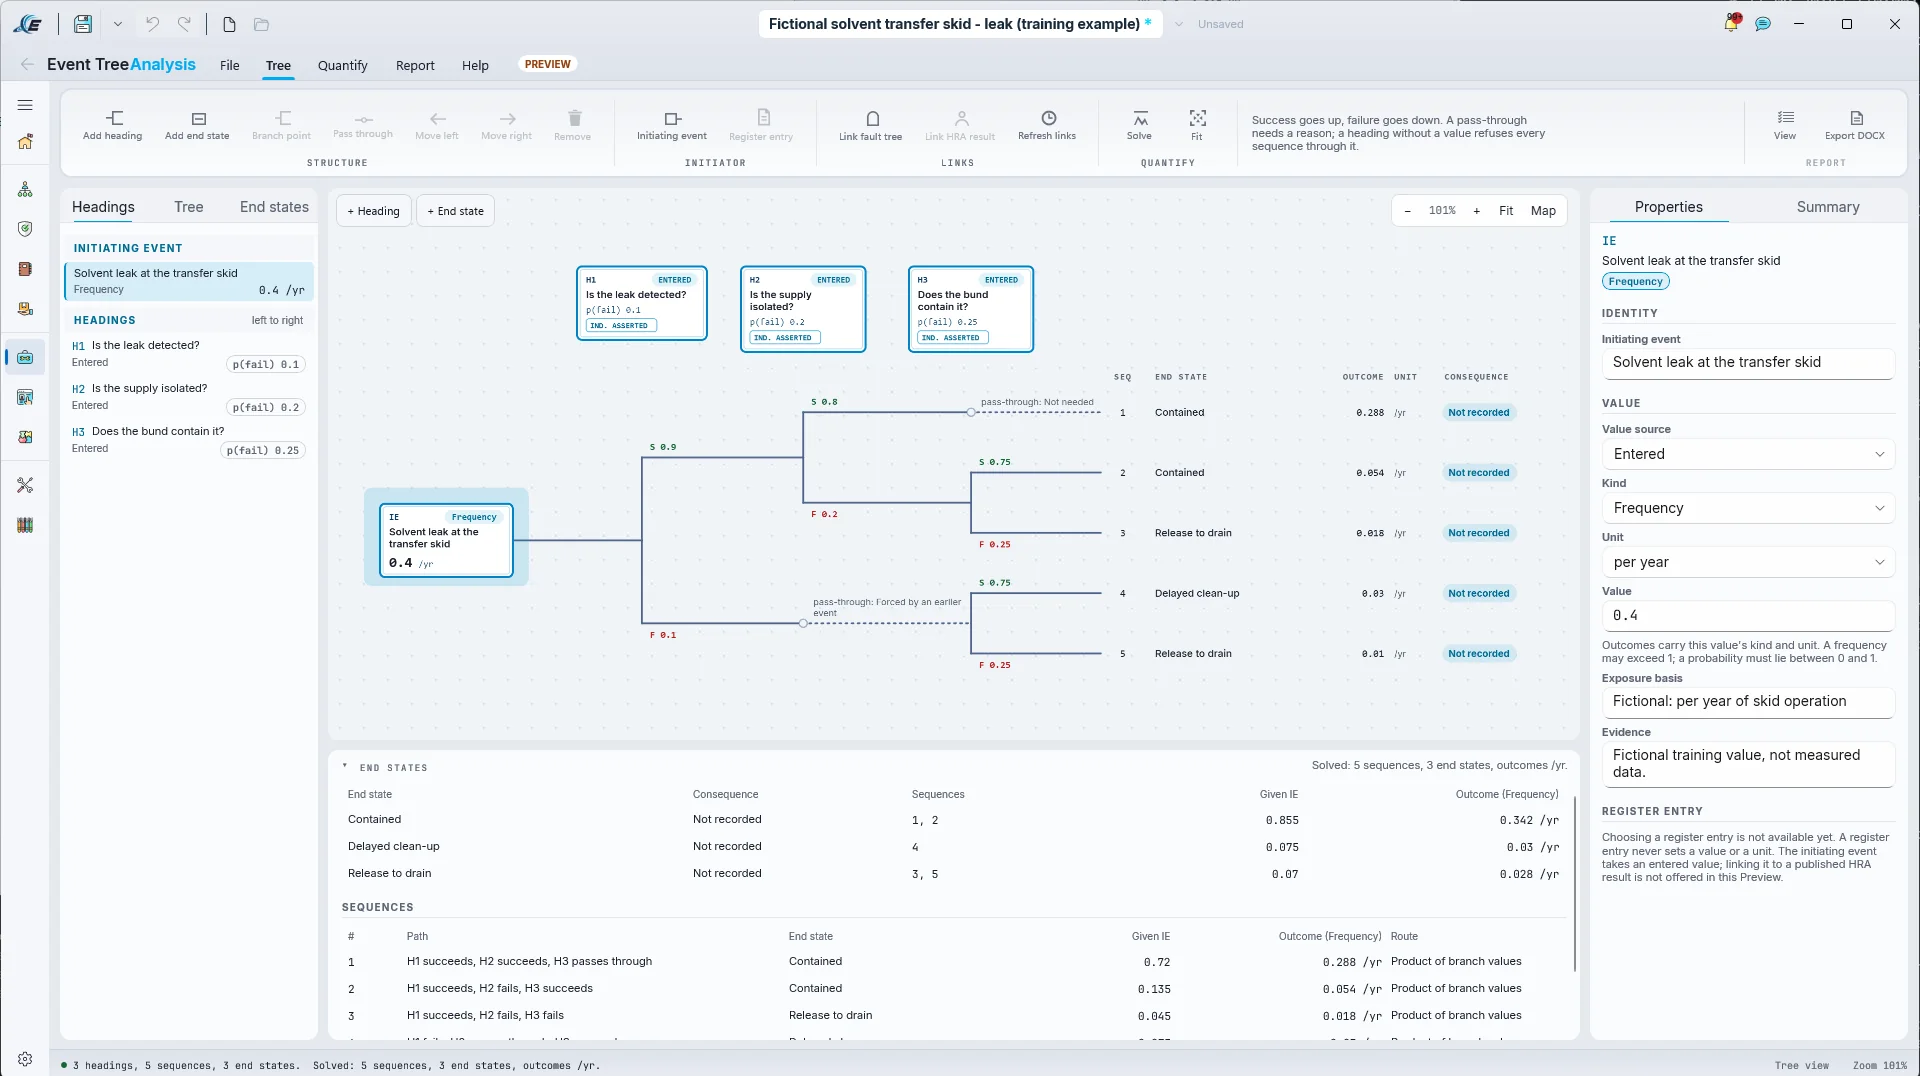
The event tree starts where the fault tree stops. An initiating event with a kind and a unit, a frequency per year in the capture, enters from the left. Each heading asks a question of a barrier, is the leak detected, is the supply isolated, does the bund contain it, and carries its probability of failure. Success goes up, failure goes down, and every sequence runs to an end state that names the consequence.
The method's rules are the tool's rules. A pass-through, where a heading does not apply on a branch, needs a reason, and the reason is printed on the branch. A heading without a value refuses every sequence through it, so a half-built tree cannot produce a number. Each heading says where its value came from, entered with its independence asserted in the capture, and the initiating event records its exposure basis and its evidence.
Link fault tree brings a fault tree into a heading, a branch point or the initiating event as logic, not as a copied number. Where two linked trees share a basic event, the whole sequence is solved exactly together rather than multiplied as if the events were independent.
- Structure
- Add heading
- Add end state
- Branch point
- Pass-through
- Initiating event
- Value
- Frequency
- Probability
- per year
- Entered
- Exposure basis
- Evidence
- Then
- Solve
- Link fault tree
- Refresh links
- Export DOCX
img/screenshots/web/eta-quantify.webpThis Is What The Board Reads.
Every one of the three tools exports a native Word document from its ribbon, and the bowtie diagram renders in the report exactly as it renders on screen. Issue the work as an .ergview package and the bowtie is live in the free Viewer: zoom it, pan it, hover a barrier, drag a node aside to see what sits behind it, with the analyst's own arrangement preserved. Read-only, no licence, no account, and the recipient's review comments travel back to you in the same file.
An issue raised here lands in the register
With severity, owner, target date and overdue state, beside the issues every other tool raised. The Issues and Standards registers export to ReqIF for IBM DOORS and other requirements tools.
Altered bytes read as a mismatch
If the file holds critical control records for a duty holder, it is evidence, and the first question an auditor asks is whether it can be altered without anyone knowing. Every save computes an integrity digest over the content and the control files together, and every load verifies it.
One answer to "is this approved"
ErgoBow's governance runs on the platform's compliance chain, with the same electronic sign-offs and the same audit events as HTA and SCTA. Frozen governance packs are verified and never re-signed.
The Bowtie, Both Trees, and the Human Reliability Behind Them.
The Safety Critical pack puts ErgoBow, Fault Tree Analysis and Event Tree Analysis in one file with the human reliability methods that give the barriers their numbers, the registers the issues land in, and the deliverables the board reads.
AUD, excluding GST. ErgoBow, FTA, ETA and SwHA are all core. Two picks from the rest of the catalogue come with it.
- Monthly over 12 months$200
- Exit anytime$259
- 11 to 25 seats, yearly, each$1,900
Any single tool here is also a pick in any other pack, or an extra at $600. Full, every tool and module, is $4,900.
Core in the pack with ErgoBow
- ErgoBow
- FTA
- ETA
- SwHA
- HTA
- SCTA
- SHERPA
- HEART+
- THERP
- CREAM
- SPAR-H
- TRACEr
- SLIM
- HE-HAZOP
- Registers
- Deliverables
The system safety trio in cyan tiles, the human reliability methods beside them, modules last. Software Hazard Analysis brings the code in the loop into the same pack.
Need to take this to a manager? The business case, with the arithmetic already done. Buying for a team? The seat bands.
Drawn Right. Then Proven.
A bowtie whose grammar is enforced, whose barriers carry real probabilities, whose controls are governed, and whose two halves are now proper trees. One hazard, one file, three of the 60 tools.