
Five weeks after 1.6.4, this release carries the most new work ErgoSphere has shipped at once, and the most testing behind it. The ErgoDesign figure now shows its muscles. The Biomechanics window colours 468 muscle fibres in twenty-two groups by the load a posture asks of them, follows that load frame by frame through a recording or an animation, and reads RULA, REBA, low back compression and the NIOSH Lifting Index on the same timeline. Healthcare arrives: a medical device Human Factors workflow from use specification through formative evaluation and validation to the HFE/UE report, aligned with IEC 62366-1, ISO 14971 and the FDA's two 2026 Human Factors guidance documents, in a Healthcare pack of its own and in Full. Three system safety methods, Fault Tree Analysis, Event Tree Analysis and Software Hazard Analysis, join the catalogue in Preview, and so does Rating Scales, one tool for the Bedford, Modified Cooper-Harper and Cooper-Harper scales; with the two new Healthcare methods the catalogue now holds sixty. ErgoBow takes on the conventional bowtie face and links straight to the trees either side of its top event. ErgoLens turns two or three calibrated cameras into one measured skeleton. The licence goes modular, and every existing key keeps everything it had. Projects from earlier releases open in 1.7; a project saved in 1.7 needs 1.7 or later, so teams sharing a project file should update together.
A test method is one [Fact] or [Theory] in the main suite's source, counted the same way at every release. The shaded segments are the methods standing behind this release's headline areas. How the suite grew is in the dossier section below.
-
Muscle Load, Drawn on the BodyNew
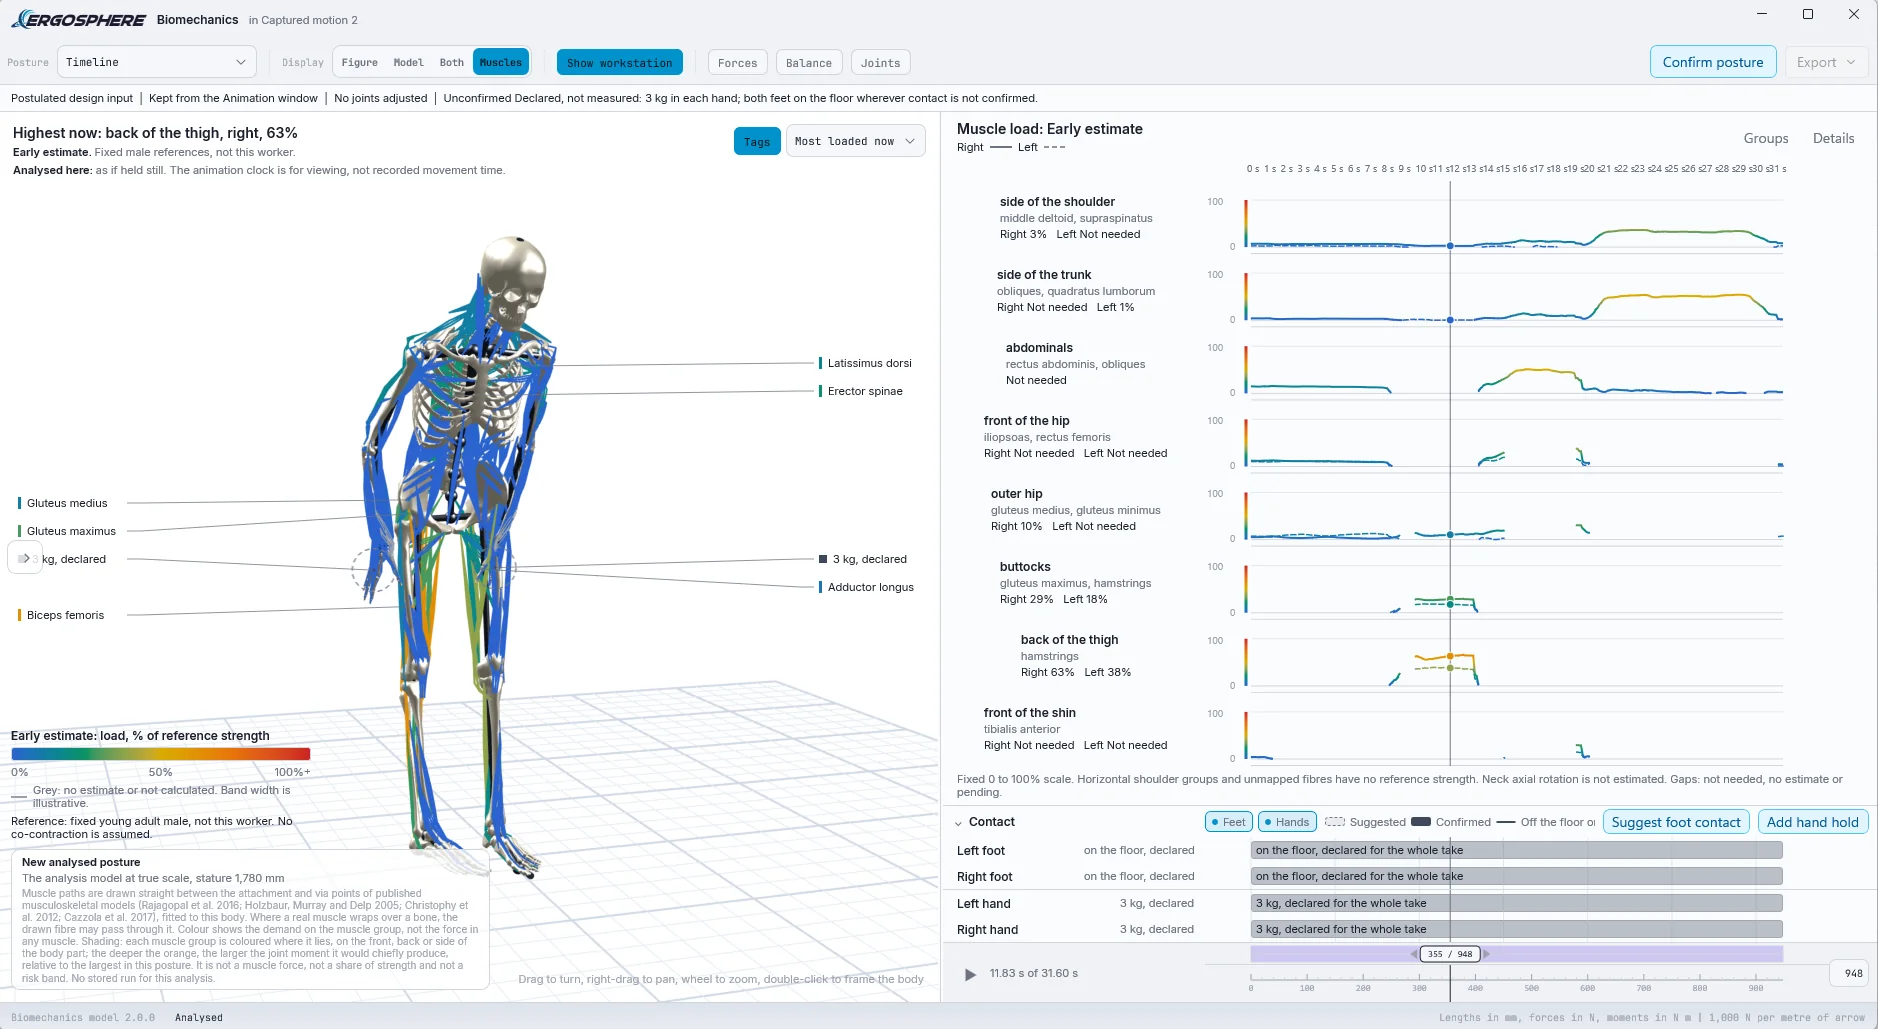
A Muscles display joins Figure, Model and Both in the Biomechanics window. It draws 468 muscle fibres on the analysed body, their paths taken from the attachment and via points of published musculoskeletal models (Rajagopal et al. 2016; Holzbaur, Murray and Delp 2005; Christophy et al. 2012; Cazzola et al. 2017) and fitted to the subject's own segment lengths. Each fibre is coloured by the load on its muscle group, on a fixed scale from blue at rest through yellow and orange to red at 100 percent and beyond. Load is the joint moment the posture requires, divided by a reference strength for the group, from Chaffin (1969), Anderson et al. (1985), Anderson, Madigan and Nussbaum (2007), Stobbe (1982) and Chaffin, Andersson and Martin (2006), with the neck matched level by level to Vasavada, Li and Delp (2001). It is labelled an Early estimate, against a fixed young adult male reference rather than this worker, with no co-contraction assumed, and the window says so in plain words: a guide to support your judgement, not a measurement of muscle activity. A fibre with no reference strength is drawn grey, never guessed.
-
Twenty-Two Groups, Head to Toe, on One Clock
Muscles are read in twenty-two named groups: the front, back and side of the neck; the front, side, inner and back of the shoulder; the front and back of the upper arm and forearm; the back extensors, side of the trunk and abdominals; the front of the hip, outer hip, buttocks and inner thigh; the front and back of the thigh, the calves and the front of the shin. Each group is named in plain words with its muscles beneath, and each has a lane across the timeline, right side solid and left side dashed, so a whole take reads top to bottom against one playhead. A headline names the most loaded group at the current frame, Highest 8 picks how many lanes to show, tags mark the key muscles on the figure, and Details gives every group's peak and mean.
-
Estimated Muscle Activation, Muscle by Muscle
For a closer look, Run estimates the activation of individual muscles from a combined published model of 722 muscles, the thoracolumbar spine and rib cage of Bruno, Bouxsein and Anderson (2015), the upper limb of Holzbaur, Murray and Delp (2005) and the lower limb of Rajagopal et al. (2016). Moment arms follow the wrapped muscle paths, forces follow the muscle model of Millard et al. (2012), and the share between muscles is found by static optimisation that minimises the sum of cubed activations. A result is shown only once the solver's answer is proven optimal by an independent check, it is labelled an unvalidated estimate rather than an EMG measurement, and the run is saved with the project.
-
Biomechanics Through Movement
The engine now follows a body as it moves, not only as it holds still. A measured recording imported from a motion capture suit is read at its full native rate, and the legs gain the inertial terms of a moving body after Karatsidis et al. (2017), with segment radii from de Leva (1996): the window says the frames are analysed with the recorded movement. An animation made in ErgoDesign is analysed on its own timing and labelled as animation timing, not a measured person. A library clip is held still and balanced for this body, the upper body as animated, the feet planted and the hips and legs re-solved over them. Every viewing frame carries its own estimate, so playback runs without gaps, and an Analyse animation button reads the frames before the posture is confirmed, with a Cancel while it works and a card that names the reason whenever a result cannot be given.
-
Contact on the Timeline
A Contact section under the timeline says where the body meets the world and when. Suggest foot contact proposes planted feet from the motion, to be confirmed, dragged or edited, including a partly lifted sole. Add hand hold records what each hand carries, and a box held in both hands is counted once. Each row reads as declared, suggested or confirmed for its stretch of the take, the stage marks how far outside the feet the floor force falls, and force values sit on short leader lines beside the arrows they belong to. In the Animation window, Link object to hand ties an item to a hand from one frame to another with a grip offset, so a carried box travels with the hand that carries it.
-
The Ergonomic Assessment TimelineNew
Beside Muscle load, an Ergonomic assessment view runs five lanes across the same take: RULA (upper limb posture score, 1 to 7), REBA (whole body posture score, 1 to 15), low back compression at L5/S1 from the single equivalent extensor model, the NIOSH Lifting Index for a declared lift frame by frame from NIOSH 94-110 (revised 2021), and the net joint reaction force, which states that it excludes muscle forces. Inputs a posture cannot show, such as load and coupling, are stated before any score appears, and until they are, the lane says what it is waiting for.
-
An Arm Behind the Trunk Reads as Extension
An upper arm more than twenty degrees behind the trunk now scores as extension, as RULA (McAtamney and Corlett 1993) and REBA (Hignett and McAtamney 2000) read it, in ErgoSense and on the assessment timeline alike. Every other frame of the reference captures reads exactly as before. Upper arm rotation is shown as not assessed.
-
A Findings Dossier for Every Posture
ErgoDesign's Findings tab now reads one posture at a time as a dossier, chosen from a pose rail or a comparison table kept in library order, with no score, sum or ranking across postures, and a Compare with picker that words the differences. Each dossier sets true-scale side and front elevations over CUELA band rulers, then a Biomechanics section with the front and side link model, compression and shear gauges drawn on the chosen limit set's own lines, percent capable, balance with a plan of the base of support and the required centre of pressure, and the joints ranked by load. Field of view, visual field, eye reference point, acuity, contacts and reach follow. Every section has a Show the maths drawer that lays out the equations with this pose's numbers and their sources.
-
Two New Samples
Generate Sample Data adds a Carry, a 50th percentile male with a 5 kg box, and a Lift, a stoop from the library with a plywood box and a Lifting Index of 0.69. Biomechanics playback controls now match the Animation window, joints are named in full, and playback is smoother on long takes.
The whole tool, window by window, is on the ErgoDesign spotlight.
-
Fault Tree AnalysisNewPreview
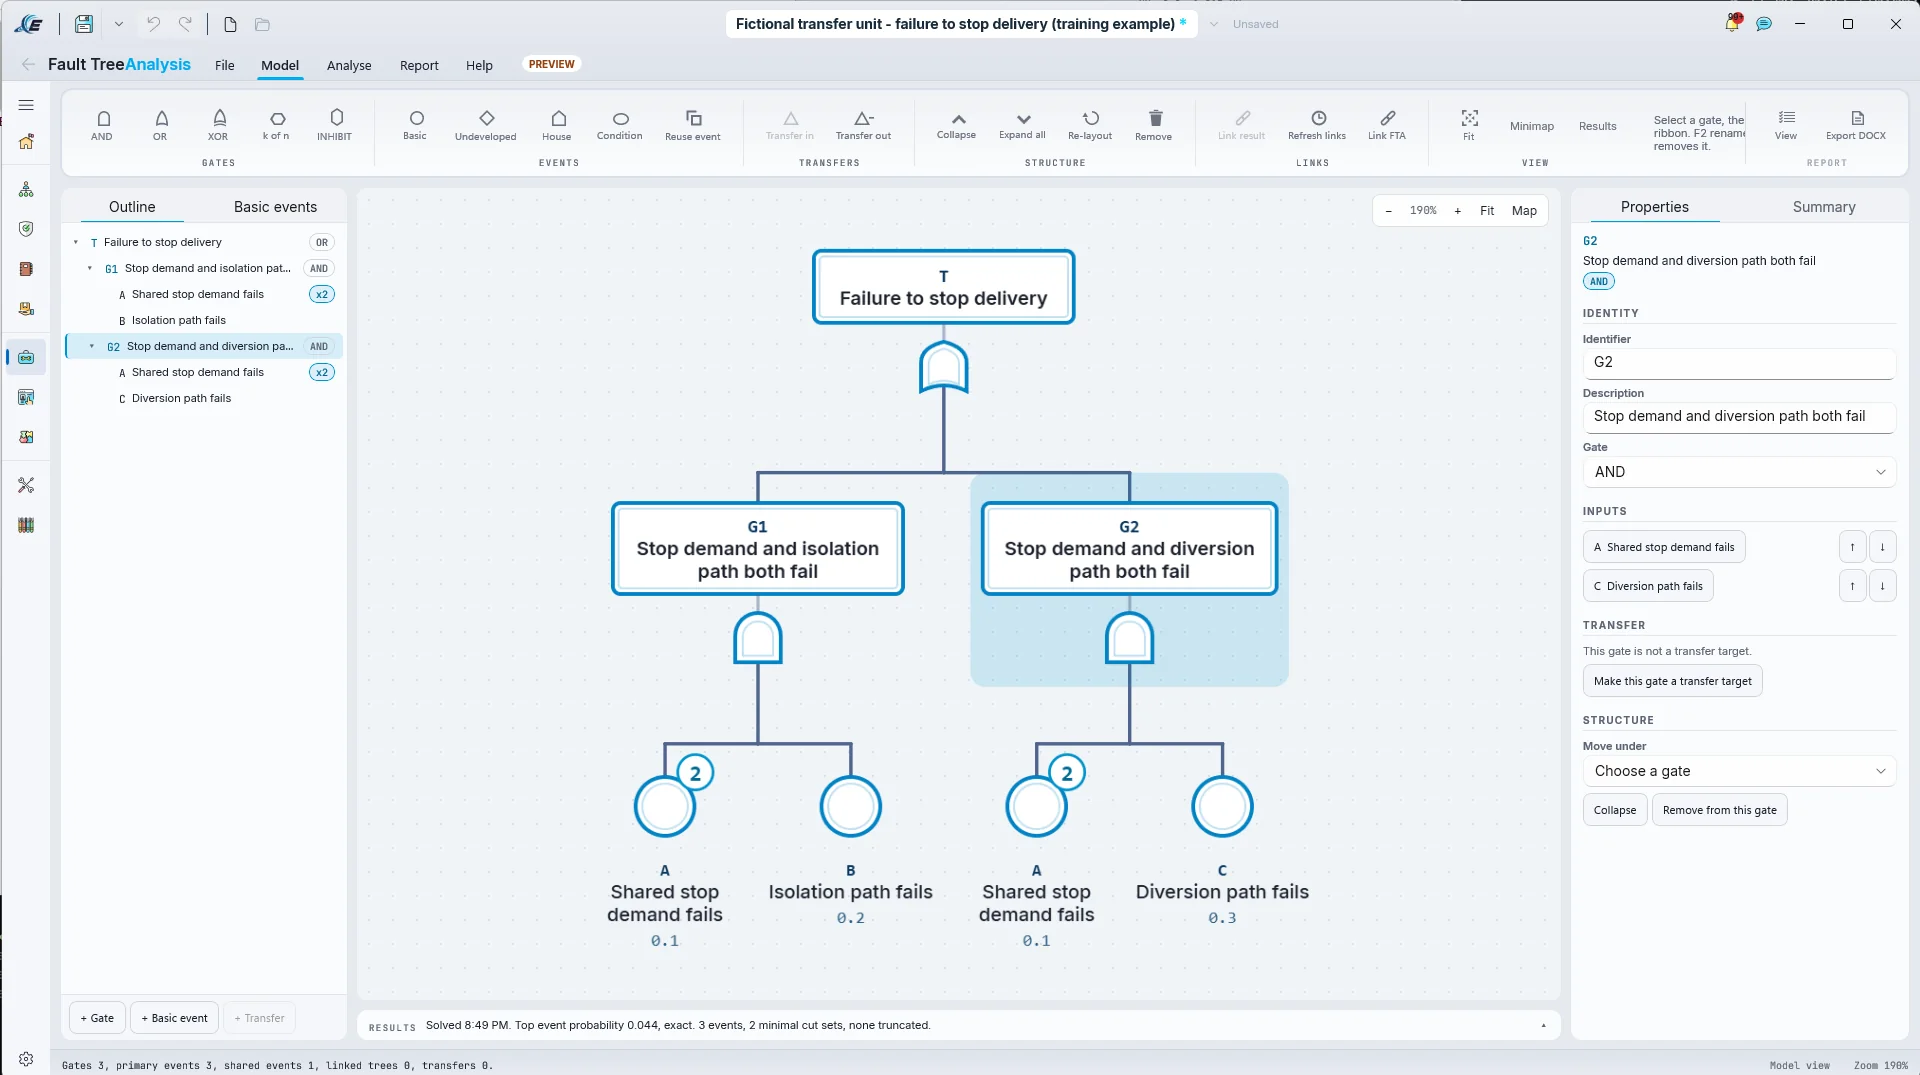
A new System Safety family opens with a fault tree editor on a shared logic tree canvas, with a tidy automatic layout, an outline, a minimap and collapsible branches. It draws AND, OR, k of n, INHIBIT and two-input XOR gates in their conventional symbols, with basic, undeveloped, house and conditioning events and transfers in and out. A shared event is one variable wherever it is used, while two events that merely share a label stay independent. A house event has no default: the top event waits until it is set. The tool ships with a fictional sample, a full method guide and a Word report that states the model, assumptions, units, link states and methods behind every figure.
-
An Exact Answer, Labelled With Its Method
The top event probability is solved exactly, by binary decision diagram, and labelled with its method. Minimal cut sets are listed beside it, with optional truncation by order or probability that reports its cut-off, the number of sets removed and the gap between the exact answer and the listed ones. The rare event sum and the minimal cut set upper bound (NUREG-0492) are shown as labelled companions, never as the headline, and the rare event sum warns when it passes 0.1. Importance measures, Birnbaum, Fussell-Vesely, risk achievement worth and risk reduction worth, each declare their scale after NUREG-0492, the NASA Fault Tree Handbook (2002) and NASA/SP-2011-3421, and a case where a measure is undefined says unbounded rather than showing zero. Basic events take fixed, per-demand, exponential, monitored, standby, periodically tested and cyclic probability models, each with its source.
-
Probabilities From Your Own HRA
A basic event can take its probability from a published human reliability result in the same project, a THERP system HEP, a SPAR-H final HEP for a human failure event, a HEART HEP or a SLIM task HEP, or from the top of another fault tree. A link reads Live, Stale, Not published or Dangling, and a stale link holds back every result that depends on it until the analyst accepts the current value, in one undoable step. A missing value is never read as zero: the headline names the events still waiting. Fault trees linked across documents are solved as one piece of logic, so an event shared between them is counted once.
-
Event Tree AnalysisNewPreview
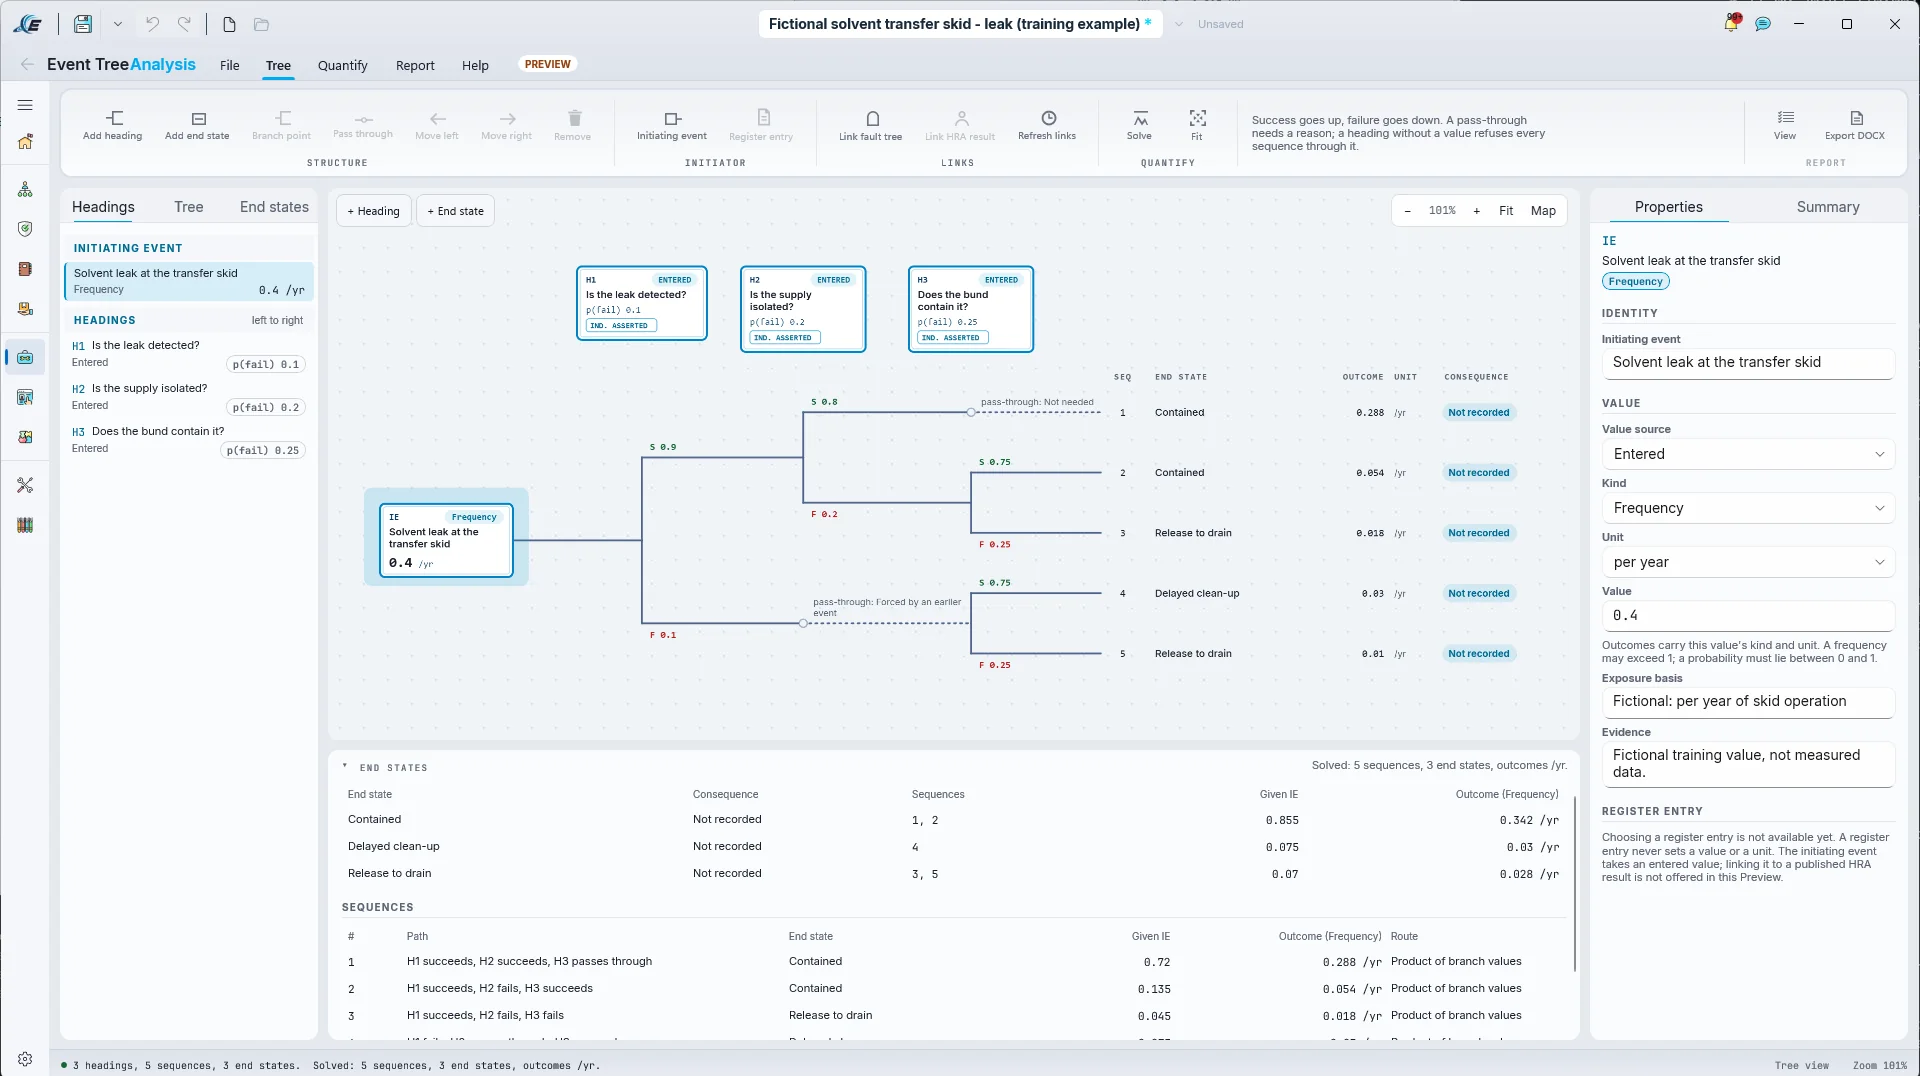
An event tree starts from one initiating event, recorded as a frequency or a probability with an explicit unit, and runs its headings left to right, success up and failure down, after NUREG/CR-2300 and NASA/SP-2011-3421. A pass-through is a deliberate node with a stated reason: not needed, forced by an earlier event, or outcome decided. Branch fractions are checked to sum to one and never quietly rescaled. Results separate what holds given the initiating event from the outcome, which carries the initiating event's kind and unit. A fault tree can be linked into a heading, a branch point or the initiating event as logic, and where two linked trees share a basic event the whole sequence is solved exactly together rather than multiplied as if independent. A sample, a method guide, a dashboard and a Word report ship with it.
-
Software Hazard AnalysisNewPreview
SwHA brings software into the hazard analysis, on a configurable scheme whose default is MIL-STD-882E with Change 1 (2023): its severity, probability and risk assessment code tables, the software control categories, the software criticality index and the level of rigour table. Each hazard record carries the Task 106 and Task 208 fields, an initial risk frozen on first record, a target risk and event risks with their own acceptance records. A software function's criticality index is derived, never typed. A Level of Rigor tracker runs from Not recorded to Complete, with evidence required to complete and a rationale required for not applicable, and a row with rigour not recorded holds back the report and acceptance. The Software Safety Criticality Matrix is drawn with the standard's own statement that it is not an assessment of risk. Acceptance records name the authority, the date and where the signed record lives, Serious and High risks need user representative concurrence, and nothing is accepted automatically. A hazard can create a fault tree top event, link to ErgoTrace, MAH and the Issues register, and a scheme can be copied and tailored under a label that says it has not been checked against a source.
Sources read for the family: NUREG-0492, the NASA Fault Tree Handbook v1.1 (2002), NUREG/CR-2300, NASA/SP-2011-3421, NUREG/CR-7039, MIL-STD-882E with Change 1 (2023) and the Joint Software Systems Safety Engineering Handbook (2010).
-
The Conventional Bowtie
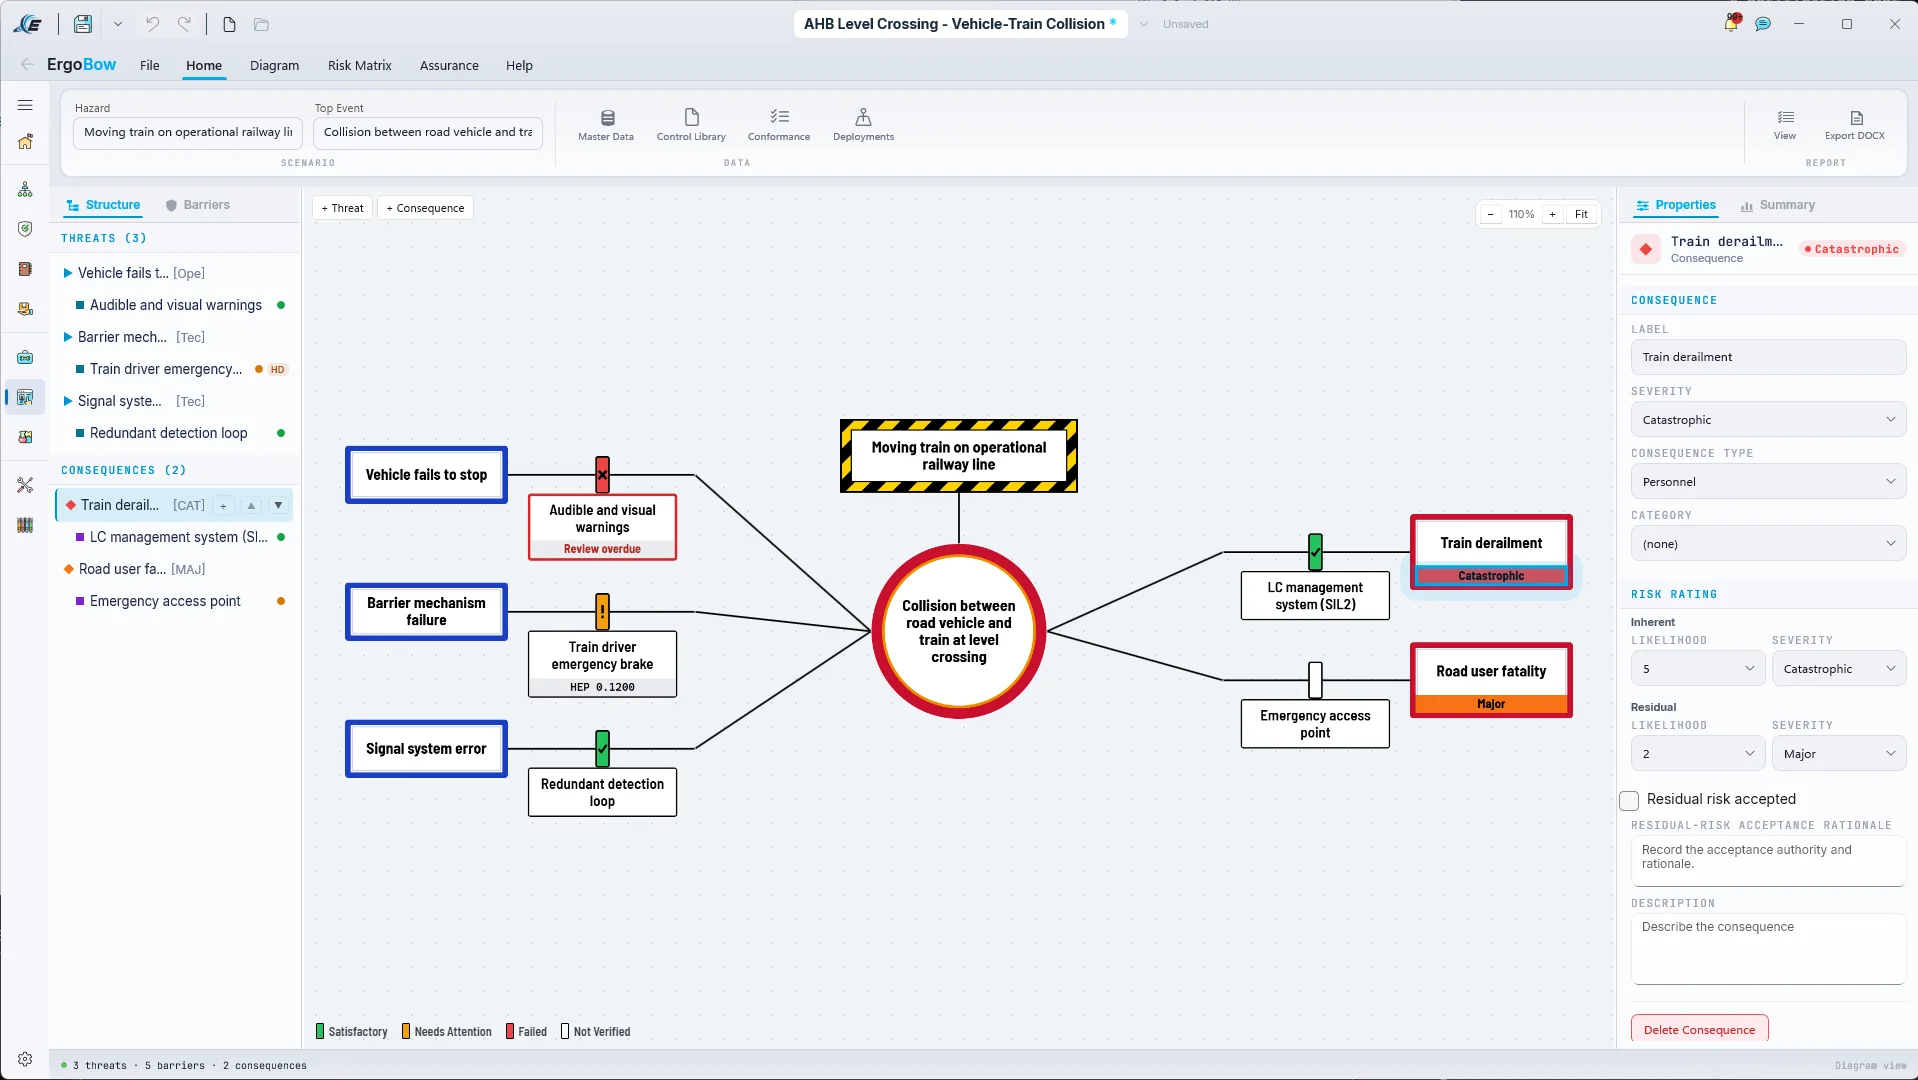
ErgoBow's diagram is redrawn in the conventions practitioners read at a glance, with ErgoSphere's own finish. Straight lines fan to the centre; a striped yellow and black hazard sign sits above a red-ringed top event; threats are blue plates on the left and consequences red plates on the right. Barriers are neutral plates on the lines, each with a status post: a green tick for satisfactory, an amber mark for needs attention, a red cross and a red outline for failed, hollow for not verified. Footer bands carry a barrier's HEP and a review that has fallen due, and each consequence carries its severity across five levels. Escalation factors hang on side branches with their own controls, and a status key sits beneath. The same picture appears in the editor, the Word report and the Viewer.
-
Linked to Fault and Event Trees
A bowtie's top event can link to the top of a fault tree and to the initiating event of an event tree, the relationship described in the CCPS and Energy Institute guidance Bow Ties in Risk Management (2018). Threats can link to a fault tree and consequences or mitigative barriers to an event tree, each link carrying the analyst's rationale. The fault and event tree editors gain a Referenced by bow ties panel that leads back, MAH shows the analyses related through a linked bowtie, and reports and the Viewer list the references. Links are for navigation and record: they do not carry probabilities or frequencies, and they do not establish barrier effectiveness, and the screen says so.
-
Start a Bowtie From the TreesNew
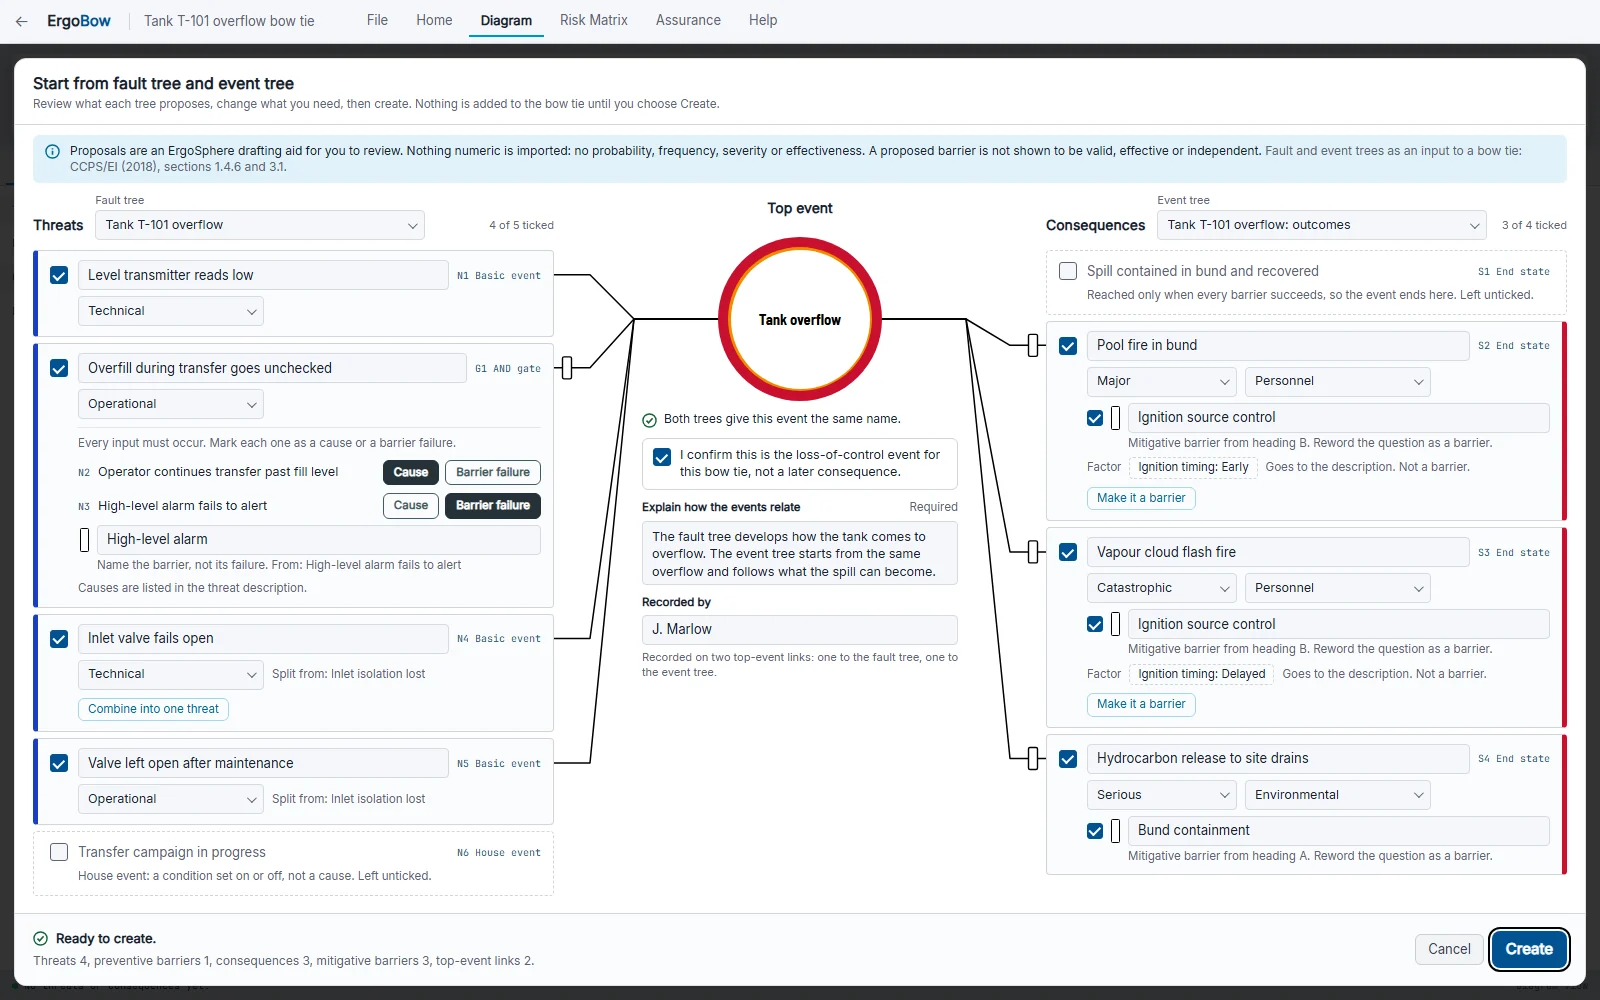
From Trees, on the ribbon and on an empty canvas, drafts a bowtie from a fault tree and an event tree. The fault tree's first-level inputs become threats, with nested OR gates expandable, and the analyst marks each AND input as a cause or a barrier failure; barrier failures become preventive barriers. The event tree's end states become consequences and its binary headings are proposed as mitigative barriers. Threat type, severity and consequence type are chosen by the analyst, nothing is pre-selected, and a label that matches an existing element is flagged and left unticked. The import is one undoable step, it creates both top event links, records where the bowtie came from, and adds a Started from analyses passage to the report. A Tank T-101 overflow sample pair shows the route.
The bowtie and both trees, side by side, are on the ErgoBow spotlight.
-
A Medical Device HF Project in One StepNew
New Project offers two starters, Blank project and Medical device HF. The medical starter asks for the device name and the planned US submission, 510(k), De Novo, PMA, HDE or not yet known, and creates linked drafts of the Use Specification, URRA, uFMEA, the medical gates and a medical Human Factors integration plan. Evidence at each of the five medical gates reads Recorded, Partly recorded or Not recorded, never Met or Pass. The standards register gains catalogue entries for IEC 62366-1 (Ed 1.0), ISO 14971, the FDA's August 2026 revision of Applying Human Factors and Usability Engineering to Medical Devices, its May 2026 guidance on the content of Human Factors information in marketing submissions, and AAMI HE75 by contents.
-
The Use Specification
A Use Specification page under Project Management records what IEC 62366-1 clause 5.1 asks for: intended use, medical indication, patient population, the part of the body or tissue, operating principle, use environments, user groups with a decision and rationale on whether each is a distinct population, and the labelling and training that come with the device. A user interface inventory flags the elements related to safety under clause 5.2, and UI requirements carry a testable statement, the elements they cover, the user need they answer and an acceptance criterion. It exports to Word on its own.
-
URRA, Traced From Scenario to Control
Each use error in the URRA now carries the client's hazard identifier, the interface elements involved, hazard-related use scenarios as ordered steps with their harms and severities (clause 5.4), several risk controls with implementation and effectiveness evidence kept apart, and Include in validation test with its rationale (clause 5.5). Critical task review stands apart from the severity threshold. The URRA and uFMEA keep step with each other through a planned, reviewable sync, and both gain a Draft, In review and Approved lifecycle.
-
Formative EvaluationNew
A Formative Evaluation tool runs rounds with a plan, pseudonymised participants by user group and tasks drawn from the URRA. A participant by task grid records completion and, independently, a use error, a close call, a difficulty or help needed. Findings carry a design response and a review state, and a finding can be sent to the URRA as a known use problem or a new use error. Rounds compare on the Study board and report to Word. The tool says what formative work is for: it supports design exploration, and it does not validate a final design.
-
HF Validation, Protocol to Root CauseNew
An HF Validation tool drafts the protocol from the critical tasks and the scenarios selected for validation, after IEC 62366-1 clauses 5.7 to 5.9 and sections 6.4.3, 8 and 8.1 of the FDA guidance. It suggests a participant target for the analyst to accept or depart from with a reason, and records test design, documentation and training conditions with their decay interval, scenarios and knowledge tasks. Lock protocol fixes a baseline; a change makes a new version with its reason, and versions compare side by side. Results count distinct participants per kind of use problem by population and scenario, and every issue gets a root cause, interface, labelling, training, test artefact or other, read as explained or undetermined. Residual risk is reviewed before and after with a rationale, and Update URRA carries the decision back. There is no success rate, by design.
-
Submission Category and the HFE/UE Report
An assurance wizard beside HF-ANR walks Figure 1 of the FDA's May 2026 content guidance, decision points A to D, to Category 1, 2 or 3, and assembles the HFE/UE report to the guidance's section structure for that category. While a report is incomplete it can be viewed and exported as a clearly labelled draft, and it cannot be marked ready, issued or packaged until it is whole.
-
Traceability for the Risk File
A use-related trace matrix runs from user need to UI requirement, critical task, use error and hazard, risk control and validation, and flags each gap. It exports as a client-mapped CSV with a manifest, a multi-sheet Excel workbook, and ReqIF for UI requirements, with mapping profiles saved per client. A client's hazard list comes in by CSV with a preview and an all-or-nothing confirm.
-
A History of Every Change
A History panel on the URRA, uFMEA, HF Validation and Use Specification, and on ErgoBow, SCTA and the HTA, lists each saved change in plain before and after words, filterable to one subject, with the saved state's fingerprint and a scoped CSV export. The twenty-five most recent saves keep full detail and older ones are summarised. It is a change record, and it says so: not an electronic signature.
-
A Worked Example and Two Method Guides
A fictional IP-40 ambulatory infusion pump opens from the Library at three checkpoints, protocol draft, validation review and after the risk update, with a walkthrough beside method guides for Formative Evaluation and HF Validation. Every claim in the guides is tied to its place in the held source and marked as source, declared or fictional.
Medical device HF comes with the Healthcare pack and with Full, both on the pricing page. ErgoSphere prepares and analyses Human Factors records for your quality system. It does not approve a device, decide a submission, guarantee clearance or provide 21 CFR Part 11 signatures, and the FDA's recommendations stay recommendations wherever they are quoted. The thread from user need to validation is walked through on the Medical Device HF spotlight.
-
Rating Scales: Bedford, Modified Cooper-Harper, Cooper-HarperNewPreview
One new tool on the Cognitive shelf hosts three scales of one family: the Bedford workload scale (Roscoe and Ellis, 1990), the Modified Cooper-Harper scale (Wierwille and Casali, 1983) and the Cooper-Harper handling qualities rating scale (Cooper and Harper, 1969). All three reach a rating from 1 to 10 the same way, so one card serves them, laid out as the scale is printed with the questions rising on the left and the bands on the right. In guided entry the rater answers the highlighted question, the band opens, and they pick the rating whose description fits best; the answers are saved with the rating. Direct entry is a grid of participants by tasks for ratings given on paper, and the results say which ratings came that way. Half ratings are offered where the source allows them, on Bedford and Cooper-Harper, with a switch to turn them off for a study. The tool ships with a method guide, sample assessments and a report that cites the source of the scale the assessment used.
-
Ordinal Results, One Task at a Time
The ratings are ordinal, so each task is summarised by its median, quartiles, range and the number of ratings in each band, with a distribution across the ten ratings and no mean. There is no figure for the whole assessment: Roscoe and Ellis report that ratings given for different tasks could not be compared with each other and were individual to each rater, so the results name the task with the highest median and a participant view shows each rater against their own ratings. The three scales share a structure and not a subject. Bedford rates spare capacity, Modified Cooper-Harper rates overall mental workload, and Cooper-Harper rates the handling of a vehicle for a stated task. An assessment therefore uses one scale, fixed once the first rating is saved, and ratings from different scales are never combined.
-
Each Scale Marked With Its Wording
Every scale in the tool states the wording it uses. Cooper-Harper is shown in the wording of its source, NASA TN D-5153. Bedford and Modified Cooper-Harper are shown in ErgoSphere wording, which keeps the published questions, their order and the meaning of each rating. Every assessment records which wording it used, and its report states it. Where a study calls for the published card exactly, raters use the card and their ratings go in by direct entry.
Rating Scales is a core tool of the Workload and SA pack and comes with Full, both on the pricing page. For workload followed through a task as it unfolds, IWS and ATWIT sit beside it; for the kind of demand behind a rating, NASA-TLX and SWAT.
-
Two Calibrated Views, One Measured SkeletonNew
ErgoLens can now record a worker from two cameras, or three, and combine the views into one skeleton in three dimensions. Each lens is calibrated from a printable checkerboard, A4 with 25 mm squares or A3 with 36 mm, with a 100 mm check bar to confirm the print scale, and a lens that has not been calibrated is not used. The board laid on the floor sets the room's frame, upright and level. Frames from each camera are paired by capture time and joints are triangulated by weighted direct linear transformation (Hartley and Zisserman), with left and right checked in every view against cues from the face and feet. A frame the cameras cannot place in three dimensions is given no score rather than a guessed one.
-
Project Details From the Start
New Project, from the File menu, Ctrl+N or either home page, opens one dialogue where only the name is needed. Client, project reference, description or scope, notes, project lead, chosen from the project team, and start and expected completion dates can be added there or later in a new This project section of Settings. A blank field is kept as not recorded. In a password-protected project the details are stored inside the encrypted entry. Deliverables take the client and reference unless told otherwise, and a new HF integration plan starts with the project's name and description.
-
A Modular Licence
ErgoSphere can now be licensed by the pack, WHS, Workload and SA, Safety Critical, Healthcare, Investigation and Systems Engineering, each a core family of tools with two picks of your own; or built from any five tools with the Deliverables module; or in full. The HTA is included in every option, the three new system safety methods join the Safety Critical core, Rating Scales joins the Workload and SA core, and the Medical Device HF module, with Formative Evaluation and HF Validation, carries the Healthcare pack and comes with Full. Every existing licence, including Champions, education, student and Defence keys, carries on as Full, so nothing changes for anyone already using ErgoSphere. The pricing page sets out each option.
-
Work Is Never Locked Away
A tool outside the licence is left off the menus rather than shown greyed, and a document made with one opens read-only and is saved back byte for byte, so a project shared between differently licensed colleagues loses nothing. A lapsed licence opens projects read-only with a prompt to reconnect, instead of closing the application. First run now goes straight to choosing a theme.
-
HTA Playback and Observed Timings
A scenario chosen in HTA Playback holds its place as the schedule refreshes, and adding, renaming or deleting scenarios updates the list in place, falling back to As written when the chosen one is removed. Adopting an observed median timing keeps the tree selection and is one clean undo step, with its source, basis and value read back exactly and the original observation runs left as recorded.
-
The Suite, Three Times Over
The main test suite holds 24,392 test methods, counted on 12 November 2026: more than three times the 7,848 that 1.6.0.0 shipped with on 30 August, and more than double the 11,162 at 1.6.1.0. Behind this release's headline areas stand 1,932 test methods for the Healthcare work, 1,402 for the system safety family, 1,263 for biomechanics and muscle load, and 133 for multi-camera ErgoLens. The Engineering Record explains how a count is taken and why it is never mixed with a run's executed cases.
-
Sources Read Before Code
Every new method began as a source fidelity audit, not a screen. For the system safety family, four audits read the fault tree, event tree and software hazard sources, each checked by an independent verifier who reproduced every worked value from the rendered source pages. For Healthcare, 939 requirement rows were extracted from IEC 62366-1, the FDA's two 2026 documents, ISO 14971, ISO/TR 24971 and the related FDA and ISO texts, each with its clause, its page and its force, shall, should, may or informative, and each extraction was verified separately. The tables behind the NIOSH lane were re-read cell by cell from the publication.
-
Engines Checked Exhaustively
The fault tree engine's exact answer is checked against full enumeration on every tree of up to sixteen basic events, and its exclusive OR against all 256 Boolean functions of three variables. Both trees reproduce the worked examples of NUREG-0492, the NASA Fault Tree Handbook, NUREG/CR-2300, NASA/SP-2011-3421 and NUREG/CR-7039, and where a printed example carries an arithmetic slip, the engine returns the correct value and the dossier records the source's figure beside it. Software Hazard Analysis is held to 73 golden cases taken from the MIL-STD-882E tables. The event tree engine and the ErgoBow links were tested by planting faults in the code on purpose, sixty-three of them in the event tree alone, and confirming that every one was caught.
-
Software Assurance: Newer Projects Stay Newer
Software assurance turned to what happens when people share a project. An older build never writes over a project saved by a newer one: on opening, on a live refresh while colleagues hold locks, on a merge save and on an overwrite, it tells the analyst in plain words that a colleague has saved with a newer ErgoSphere, and offers Save As. A newer project is never mistaken for a damaged one and replaced from an older backup. Save As writes to a temporary file and replaces the original in one step, and stored biomechanics runs carry across application updates. Teams sharing a project file should move to 1.7 together.